How to Test Loading Time or Speed of Website – 5 Free Tools for Testing Website Performance
Website speed is something that should be taken very seriously, especially since it has such a big impact on SEO.
You want to speed up your slow loading website? Do you need to do a total loading time analysis and find out which things are slowing down your website? Looking for free online tool for website speed analysis? In this blog, Codeboxr Team provide you 5 Free Tool for Testing Website Performance in terms of loading/speed.
To help you out, we gathered top 5 free tools for testing your website speed. These tools are free and some are need just registration , so make sure to check out each of them.
1. Pingdom Website Speed Test

Feature:
Examine all parts of a web page – View file sizes, load times, and other details about every single element of a web page (HTML, JavaScript and CSS files, images, etc.). You can sort and filter this list in different ways to identify performance bottlenecks.
Performance overview – We automatically put together plenty of performance-related statistics for you based on the test result
Performance grade and tips – See how your website conforms to performance best practices from Google Page Speed (similar to Yahoo’s Yslow). You can get some great tips on how to speed up your website this way.
Trace your performance history – We save each test for you so you can review it later and also see how things change over time (with pretty charts!).
Test from multiple locations – See how fast a website loads in Europe, the United States, etc.
Share your results – We’ve made it easy for you to perform a test and share it with your friends, work colleagues or web host.
How it works
All tests are done with real web browsers, so the results match the end-user experience exactly. We use a bunch of instances of Google’s Chrome web browser to load websites, record performance data, and so on. Tests are done from dedicated Pingdom servers.
Visit Pingdom.
2. Gtmetrix
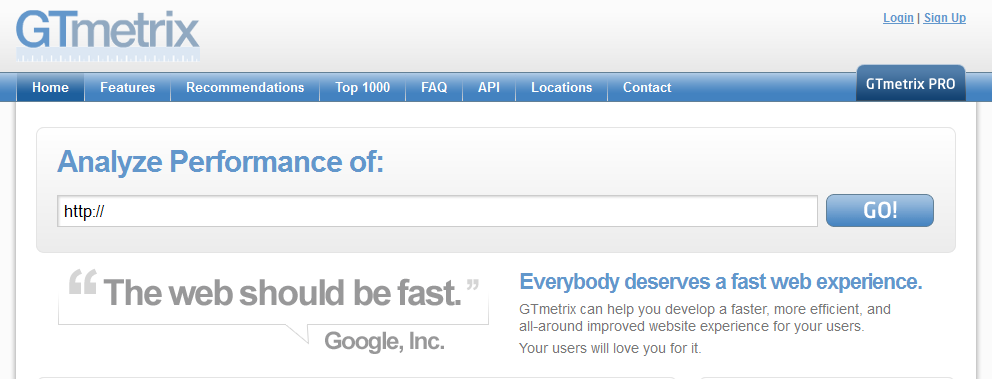
Feature:
Track History with Graphs
Keep track of the performance for your page and visualize your history with 3 interactive graphs. Zoom, pan, set a date range and more! Notes give you the ability to mark spikes in performance and give your data context.
Analyze on an actual Android devicec
See your page performance on an actual Android device! GTmetrix passes your URL through an actual Android device to get real world performance data on your page load. Optimize your site for mobile users and ensure a fast page load time on their devices!
Playback Page Loads with Videos
You can record your page loads and pin point exactly where bottlenecks or stoppages occur! Slow your playback up to 4 times the original speed to determine loading issues, and jump to major page load milestones such as DNS Resolved, First Byte and DOM Loaded.Only with Chrome, Safari or IE9+ When used with our monitored alerts feature, GTmetrix will save a video of the page load that triggered the alert for viewing (only available toGTmetrix PRO users.) You can also view your page load in a filmstrip view. This allows you to get a frame-by-frame look at your page loading in real time.
Set up Monitored Alerts
GTmetrix can alert you if your page falls below a certain condition you set! Set numerous conditions based on page Speed/YSlow score, Page load time, Total Page size, etc, and get an e-mail notification whenever any are triggered. Perfect for proactive monitoring and ensuring your site is as fast as it can be at all times.
…and much more options and features!
Visit Gtmetrix
3. Loadimpact
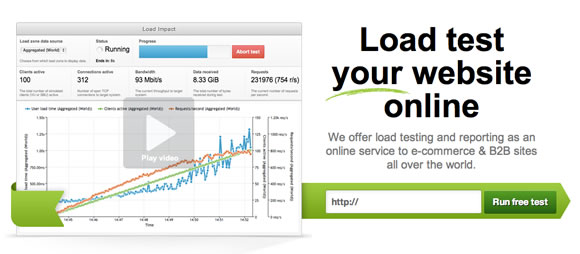
Features:
Large scale load tests
Up to 100,000 simulated users in a single test.
Multiple user scenarios
Emulate different user types in a single test and get individual measurements for each type.
Extremely accessible service
Instant, on-demand & pay-as-you-go load testing. No waiting to get access and no long-term subscriptions required.
Geographic distribution of load
Load generated from multiple geographical locations.
Real-time testing
Watch and control your load test in real time. View results as they are coming in, live. Your graphs are updated dynamically throughout the load test.
Powerful reporting
Generate reports with multiple charts containing multiple measurement metrics for easy correlation.
Session recorder
Record an HTTP session and let the simulated users perform the same actions during the test.
Advanced scripting
Script user scenarios in the simple but powerful high-level language Lua, using our programmer friendly IDE with code completion and inline documentation.
Server metrics
Install our lightweight monitoring agent on the servers you are load testing and get detailed information about resource utilisation (CPU, memory usage, etc) on your machines during your load test.
Automatic script generation
Analyze a web page and generate a load script that loads the page just like a browser would. No programming required.
Flexible
Supports any HTTP-based application or service, whether it is Flash, AJAX, SOAP/XML apps etc.
Scheduling
Configure your load tests to run in the middle of the night, or to be run once per week. You don’t have to be around at all.
Browser emulation
Configure your load test to emulate popular browsers such as Firefox, IE, Chrome, Safari etc. or more exotic types of user agents such as GoogleBot.
Intuitive UI
Dynamic interface that gives you a quick overview and also shows you the details when you need them.
Cloud service
We are a cloud service. We use all the latest and most popular buzzwords.
Visit Loadimpact
4. Web Page Test
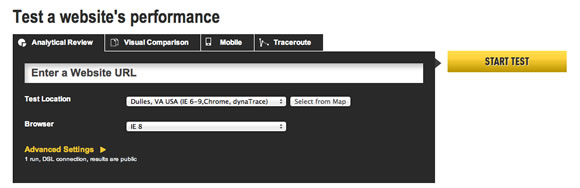
Run a free website speed test from multiple locations around the globe using real browsers (IE and Chrome) and at real consumer connection speeds. You can run simple tests or perform advanced testing including multi-step transactions, video capture, content blocking and much more. Your results will provide rich diagnostic information including resource loading waterfall charts, Page Speed optimization checks and suggestions for improvements.
Visit Webpagetest
5. Show Slow
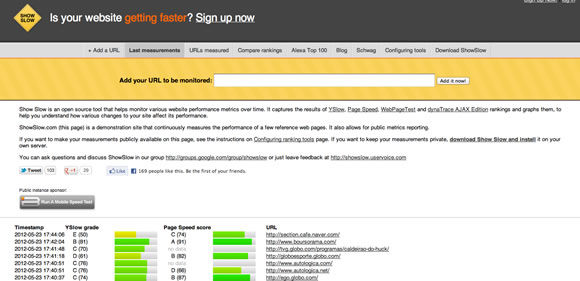
Show Slow is an open source tool that helps monitor various website performance metrics over time. It captures the results of YSlow, Page Speed Insights, WebPageTest and dynaTrace AJAX Edition rankings and graphs them, to help you understand how various changes to your site affect its performance.
ShowSlow.com (this page) is a demonstration site that continuously measures the performance of a few reference web pages. It also allows for public metrics reporting, and keeps data for 90 days.
If you want to make your measurements publicly available on this page, see the instructions on Configuring ranking tools page. If you want to keep your measurements private, download Show Slow and install it on your own server.
Visit Show Slow


